Tutorials
How to Create a Budget Spreadsheet in Google Sheets
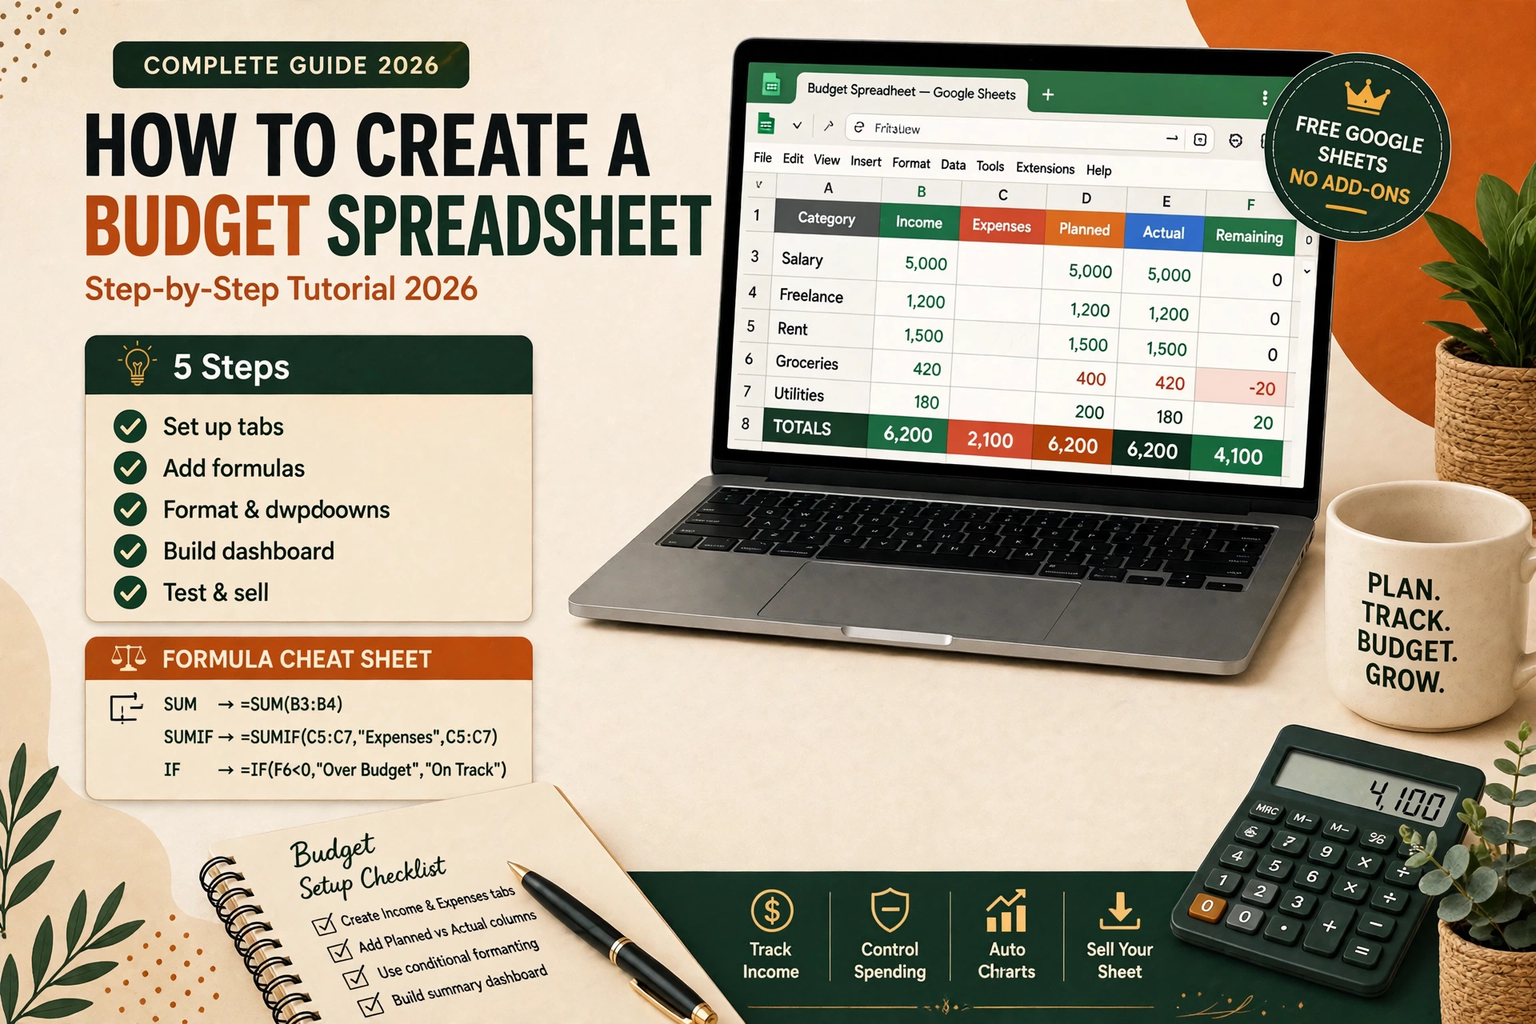
Learn how to create a budget spreadsheet in Google Sheets step by step — income, expenses, formulas, charts and a monthly dashboard — and turn it into a digital product you can sell.
A budget spreadsheet is one of the most useful things you can build in Google Sheets — and one of the easiest digital products to sell. Unlike a printable planner, a spreadsheet does the maths for its owner: it adds up spending, flags overspending, and shows exactly how much is left at the end of the month. That is why budget spreadsheets sell for $5–$20 on Etsy and Gumroad, and why a good one is a strong first product for a beginner seller.
This tutorial builds a complete monthly budget spreadsheet in Google Sheets from a blank sheet: income, expenses, automatic totals, a savings tracker, and a simple dashboard with charts. No add-ons, no paid tools, and no formulas knowledge needed — every formula is given in full, ready to copy. At the end, you will also see how to turn the same spreadsheet into a product you can sell, including how to protect your work and what to charge for it.
What a good budget spreadsheet needs
Before you type anything, decide what the spreadsheet must do. A budget that only lists numbers is a notebook, not a tool. A good one answers four questions at a glance:
- How much money came in? All income, in one place.
- Where did it go? Spending grouped by category, not one long list.
- How much is left? Income minus spending, calculated automatically.
- Am I on track? Each category compared against the amount planned for it.
That is the whole design. Everything in this tutorial serves one of those four questions. If a feature does not help answer one of them, leave it out — a spreadsheet that tries to do everything ends up confusing the person using it.
It also helps to decide who the sheet is for. A sheet for your own household can be rough and personal. A sheet you plan to sell needs clean labels, a short instructions tab, and no personal numbers left inside it. Build it the second way from the start and you will not have to rebuild it later.
Step 1: Set up the skeleton — tabs and columns
Open Google Sheets and start a blank spreadsheet. Rename it "Monthly Budget" and create three tabs using the + button at the bottom: Budget, Transactions, and Dashboard. The Budget tab holds the plan, Transactions holds the day-to-day entries, and the Dashboard shows the summary.
Build the Budget tab
On the Budget tab, set up the plan like this:
- In cell A1, type Monthly Budget. In B1, type the month, for example "November 2026".
- Row 3 is your header row: A3 Category, B3 Planned, C3 Actual, D3 Remaining.
- Under Income, list your sources in column A: Salary, Freelance, Shop sales, Other income. Put the expected amount for each in column B.
- Under Expenses, group spending into categories: Housing, Food & groceries, Transport, Bills & utilities, Entertainment, Savings, Other. Put the planned amount for each in column B.
- Leave a blank row between the income block and the expense block so the sheet is easy to scan.
Keep categories broad. Ten to fourteen expense categories is the sweet spot — fewer and the budget is useless, more and nobody keeps it updated. If you are building this to sell, use categories that fit most buyers (housing, food, transport, bills) and add one "Other" row so unusual spending still has a home.
Build the Transactions tab
The Transactions tab is the daily log. Set up four columns:
| Column | Header | What goes here |
|---|---|---|
| A | Date | The date of the purchase, for example 2026-11-08 |
| B | Description | What it was — "Weekly groceries", "Bus pass" |
| C | Category | Must match a category on the Budget tab exactly |
| D | Amount | The amount spent (or received, for income rows) |
The category column is the key to the whole sheet: every formula in the next step reads it. Spelling must match the Budget tab exactly — "Food & groceries" and "Food and groceries" are two different categories to a formula. We will fix that risk with a dropdown in Step 3.
Step 2: Add the formulas that do the work
You only need four formulas to make the sheet genuinely useful. Copy them exactly, adjusting the row numbers to match your own layout.
Total income and total spending
On the Budget tab, below your income list, add a Total income row and use SUM to add the planned amounts:
=SUM(B5:B8)
Do the same below the expense list for Total planned spending. SUM is the most used formula in any budget sheet, and it is the only one you truly cannot avoid.
Actual spending per category, pulled from Transactions
This is the formula that makes the sheet feel automatic. In the Actual column (C) of the Budget tab, next to each expense category, enter a SUMIF that adds up every transaction in that category:
=SUMIF(Transactions!C:C, A10, Transactions!D:D)
In plain words: look down the Category column of the Transactions tab, find every row where the category matches the one in cell A10, and add up the amounts. Change A10 to the row of the category you are on, and copy the formula down the column. When a new transaction is logged, the Actual column updates itself.
Remaining per category
In the Remaining column (D), subtract actual from planned:
=B10-C10
A positive number means money is left in that category; a negative number means the budget was overspent. This is the number most people check every day, so make it easy to read — we will colour it in the next step.
Money left at the end of the month
At the bottom of the Budget tab, add a Money left row:
=Total income - Total actual spending
That single cell is the headline of the whole spreadsheet. Everything else exists to explain it.
Formula cheat sheet
| Formula | What it does | Example |
|---|---|---|
| SUM | Adds a range of numbers | =SUM(B5:B8) |
| SUMIF | Adds only the rows that match a condition | =SUMIF(Transactions!C:C, A10, Transactions!D:D) |
| AVERAGE | Average of a range — useful for monthly averages | =AVERAGE(C10:C21) |
| COUNTIF | Counts how many transactions fall in a category | =COUNTIF(Transactions!C:C, A10) |
| IF | Shows a message when a condition is true | =IF(D10<0, "Over budget!", "On track") |
The IF formula in the last row is optional, but it is the one that makes a sheet feel smart: a small status column that says "Over budget!" in plain words, next to the number, catches the eye faster than a negative figure alone.
Step 3: Make it look like a product, not a maths exercise
A spreadsheet people enjoy opening is a spreadsheet people actually use — and if you sell it, the design is half the product. Four formatting moves cover most of it.
1. Add a category dropdown so nothing gets misspelled
Select the Category column on the Transactions tab, then go to Data > Data validation > Dropdown from a range and point it at the category list on the Budget tab. Now every transaction picks its category from a list, so SUMIF can never fail because of a typo. This one change prevents the most common support question a spreadsheet seller gets.
2. Format money properly
Select every amount column and apply Format > Number > Currency. Amounts should always show the same currency symbol and two decimal places. Mixed formats — some cells with $, some without, some with three decimals — are the fastest way to make a sheet look unfinished.
3. Colour the numbers that matter
Use conditional formatting on the Remaining column: Format > Conditional formatting, then set a rule that colours a cell green when it is greater than 0 and red when it is less than 0. A glance at the column then tells the whole story without reading a single number. Keep the palette to two or three colours — green, red, and a neutral header colour — so the sheet stays calm and readable.
4. Freeze the header and tidy the columns
Select row 1 on each tab and use View > Freeze > 1 row so the headers stay visible while scrolling. Widen columns so nothing is cut off, and give the title row a bold, larger font with a fill colour. These are small touches, but they are what separate a sheet that looks made from one that looks thrown together.
Step 4: Add a monthly dashboard with charts
The Dashboard tab turns the Budget and Transactions tabs into a picture. You need only two visuals:
- A spending-by-category pie or bar chart. Select the category names and Actual amounts on the Budget tab, then Insert > Chart and choose a pie chart. It instantly shows which category eats the most money — usually housing or food — and it is the chart buyers screenshot when they share their budget online.
- A planned vs actual bar chart. Select the category, Planned, and Actual columns and insert a column chart. Where the actual bar is taller than the planned bar, the category is over budget. This is the chart that actually changes behaviour.
Place both charts on the Dashboard tab, add a title above each one, and add the "Money left" figure at the top in a large font. Three elements on the tab is enough — a dashboard crammed with six charts is a dashboard nobody reads. If you want a monthly comparison later, duplicate the Budget tab for each new month and add a small table on the Dashboard that pulls each month's "Money left" figure into one row.
Step 5: Test it like a buyer would
Before you call the sheet finished — and especially before you sell it — test it as a stranger would:
- Add a transaction in every category and confirm the Actual column and the charts update. If a category stays at zero, the SUMIF range or the category spelling is wrong.
- Type a nonsense category into a transaction (or pick a category that does not exist) and see what breaks. If you added the dropdown in Step 3, this should be impossible — which is the point.
- Delete all the test transactions and confirm the sheet returns to clean zeros, with no error messages like #REF! or #VALUE! anywhere.
- Open it on a phone. Google Sheets on mobile hides wide tables badly. If your sheet is wider than about six columns, buyers on phones will struggle — keep it narrow.
- Check the print view. If the sheet is meant to be printed, use File > Print and confirm each tab fits on one page without tiny text.
Fix anything that breaks now. A buyer who finds a broken formula in the first five minutes asks for a refund; a buyer who finds a working sheet tells a friend.
Turn your budget spreadsheet into a product you can sell
The same sheet you just built is a sellable digital product. Budget spreadsheets are one of the most searched finance templates on Etsy, and buyers expect to pay $5–$20 for a well-made one. Here is how to prepare it for sale.
Clean it and protect your work
Make a copy of your sheet and delete every personal transaction and amount from it, leaving example rows only — two or three sample transactions so the buyer can see how it works, clearly labelled as examples. Then protect the formula cells: select them, go to Data > Protect sheets and ranges, and set a warning (or full protection) so a buyer cannot accidentally delete a formula. Leave the input cells — amounts, descriptions, dates — editable.
Add an instructions tab
Add a first tab called Start Here with three things: what the spreadsheet does, how to make a copy of it (File > Make a copy), and where to type their own numbers. Keep it under a page — buyers skim instructions, they do not study them. A short video of you using the sheet, even a 60-second phone recording, answers more questions than three pages of text.
Price it, list it, and deliver it
Price it using the same thinking as any other digital product: check what similar budget spreadsheets sell for, position yours on quality and features rather than being the cheapest, and remember the platform fees on every sale. Our guide on how to price digital products walks through fee maths, pricing psychology, and bundles in detail. If you sell it alongside a planner or a template, consider packaging them together — our tutorial on how to create a digital product bundle covers bundle pricing and what to include. For the listing itself, our tutorial on delivering a digital download on Gumroad and Etsy covers file formats, ZIP packaging, and testing the buyer journey before you publish.
Delivery for a Google Sheets product is slightly different from a PDF: buyers usually receive a PDF instruction sheet with a "Make a copy" link to your sheet, rather than the sheet file itself. That way you keep control of the master copy, and the buyer gets their own editable version. Test the link in a private browser window before you publish — a link that asks the buyer to request access is the most common delivery failure for spreadsheet sellers.
Common budget spreadsheet mistakes
Tracking every cent from day one. Beginners often build a sheet with forty categories and abandon it in a week. Start with ten categories and add more only when you keep missing the same kind of spending.
Mixing planned and actual in the same column. Keep them in separate columns, always. The moment they share a column, you can no longer tell whether you overspent or under-planned.
Forgetting irregular costs. Annual insurance, car servicing, and school fees are not monthly, but they still need a budget. Divide each annual cost by 12 and budget that amount monthly, or keep a separate "Annual costs" section on the Budget tab so they do not appear as surprise spending.
Copying the sheet without checking the formulas. When you duplicate the sheet for a new month, check that SUMIF still points at the right Transactions tab. A copied sheet that still reads last month's transactions gives last month's answers.
Making it too wide. A budget sheet with twelve columns looks impressive and is unusable. If a column does not change a decision, delete it.
FAQ
Is Google Sheets free for this?
Yes. A free Google account includes Google Sheets, and everything in this tutorial works on the free plan — formulas, charts, conditional formatting, and dropdowns included. The buyer needs only a free Google account to use your sheet.
Can I use this spreadsheet in Excel instead?
Mostly, yes. SUM, SUMIF, AVERAGE, COUNTIF, and IF all work in Excel with the same syntax. Conditional formatting and data validation exist in Excel too, though the menus are in different places. Charts will need minor adjustment. If you sell the sheet, say clearly in the listing whether it is built for Google Sheets, Excel, or both.
How do I budget for a month when my income changes?
Put your lowest realistic income in the Planned column and treat anything above it as a bonus. Budget the base income first — housing, food, bills — then assign extra income to savings or debt when it arrives, rather than spending it in advance.
What if a category keeps going over budget every month?
That is useful information, not a failure. Either the planned amount was unrealistic, or the spending is genuinely higher than you thought. After two months over budget in the same category, raise the planned amount and reduce a flexible category to compensate — the budget should describe your real life, not an ideal version of it.
Can I really sell a simple budget spreadsheet?
Yes — buyers are paying for a finished, tested, well-designed tool they do not have to build themselves, plus the instructions and the time saved. A clean sheet with working formulas, a dashboard, and clear instructions sells; a rough sheet with broken formulas does not. The difference is the testing in Step 5.
Do I need to know formulas to use a budget spreadsheet I buy?
No. A well-made sheet only asks the buyer to type dates, descriptions, categories, and amounts. The formulas do the rest. If a sheet asks the buyer to write formulas, it is unfinished.
Related reading
If you want a ready-made budget tool instead of building one, try DigiDown's free Budget Planner Pro — a free interactive budget tracker you can start using today. And if you are building a catalogue of products to sell, our guide to 15 digital product ideas for teachers and educators is full of spreadsheet-friendly product ideas, from grade trackers to lesson planners.